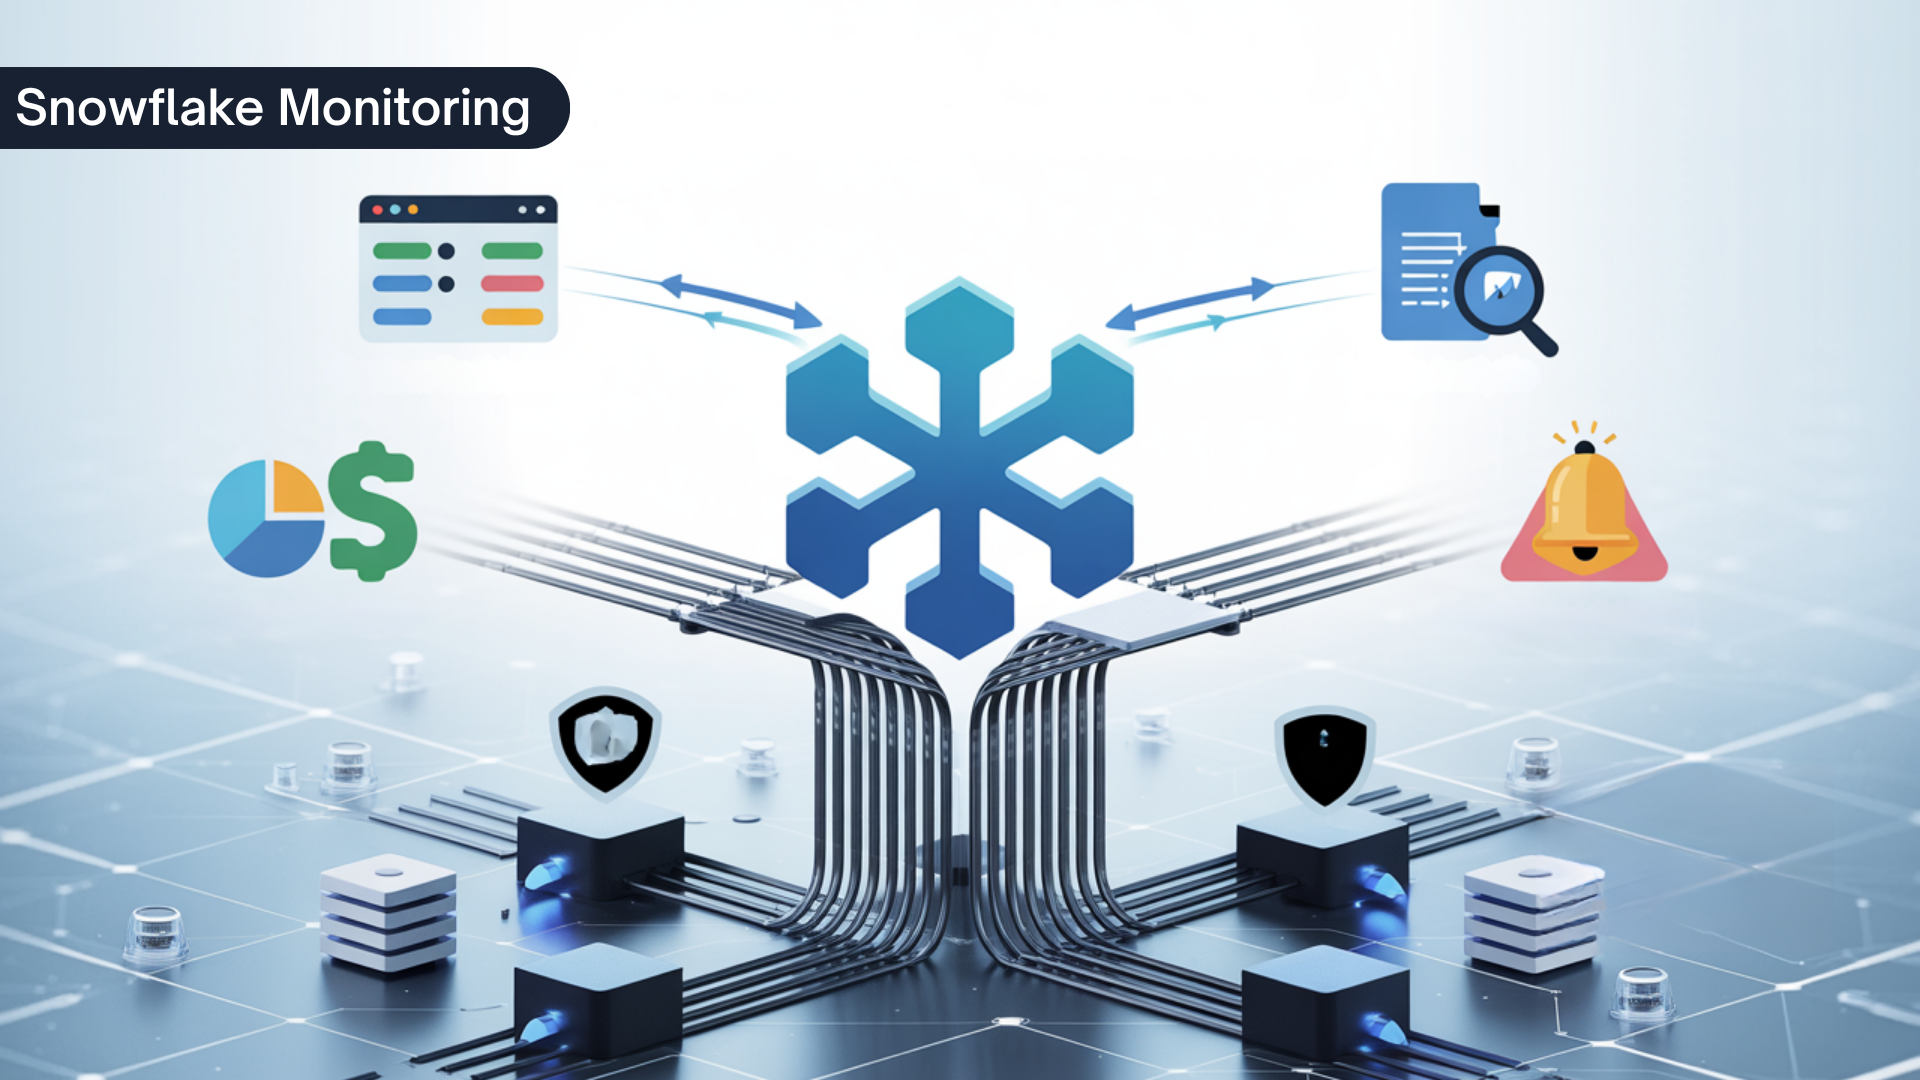
Monitoring, auditing, and observability in Snowflake are essential practices that ensure effective data governance, security, and performance optimization. As organizations increasingly rely on data for critical decision-making, understanding how to manage and monitor Snowflake environments becomes paramount. Therefore, this article delves deeply into various aspects of monitoring, auditing, and observability, focusing on building custom dashboards, query-level cost attribution, log analysis, and setting up alerts.
Building Custom Dashboards with ACCOUNT_USAGE and INFORMATION_SCHEMA
Creating custom dashboards is vital for gaining insights into your Snowflake environment. By leveraging the ACCOUNT_USAGE and INFORMATION_SCHEMA views, users can efficiently visualize data. These views provide a comprehensive overview of account activity, user behavior, and resource utilization.
Understanding ACCOUNT_USAGE
The ACCOUNT_USAGE schema contains historical data about your Snowflake account. This includes several key components, which are crucial for effective monitoring:
- Query History: This provides detailed information about each query executed in your account, such as execution time, user, and warehouse. Thus, this data is essential for identifying performance issues and optimizing query execution.
- Login History: Records of user logins and their activities help identify unusual access patterns that could indicate potential security issues. Consequently, monitoring login history is vital for ensuring that only authorized users have access to sensitive data.
- Warehouse Usage: Insights into the performance and utilization of compute resources allow for proactive management of workloads and ensure optimal resource allocation. Understanding warehouse usage, therefore, helps in scaling resources effectively according to workload demands.
By creating custom dashboards that visualize these metrics, organizations can monitor their Snowflake environments in real time. For instance, displaying login attempts alongside query performance metrics can help identify potential security threats or performance bottlenecks.
Utilizing INFORMATION_SCHEMA
The INFORMATION_SCHEMA provides metadata about your databases, tables, and other objects. This schema is essential for auditing and governance. Key components include:
- Tables and Columns: This offers information about table structures, data types, and relationships, which are crucial for understanding data architecture and ensuring data integrity.
- Roles and Permissions: Insights into user permissions and roles assigned to various objects ensure compliance with data governance policies. By tracking permissions, organizations can avoid unauthorized access and maintain data security effectively.
By combining data from both ACCOUNT_USAGE and INFORMATION_SCHEMA, you can create a powerful dashboard that visualizes user activity, performance metrics, and compliance status. For example, tracking changes in user roles alongside warehouse usage can provide insights into how resource allocation is affected by user activity.
Practical Steps for Dashboard Creation
To create effective dashboards, consider the following practical steps:
- Identify Key Metrics: Determine what metrics are most important for your organization. This might include query performance, user activity, or resource usage. Understanding your business goals will guide what to monitor.
- Select Visualization Tools: Use tools like Tableau, Power BI, or even native Snowflake dashboards to create visual representations of your data. Consequently, visualization tools help in making complex data easily understandable.
- Design Dashboards for Different Stakeholders: Tailor dashboards for different audiences, such as executives, data engineers, or compliance officers, ensuring they receive relevant information. Customizing the view makes it easier for stakeholders to derive insights.
- Automate Data Refresh: Set up automatic data refresh intervals to ensure that dashboards reflect the most current data. This prevents users from making decisions based on outdated information, thereby ensuring accuracy in reporting.
- Test and Iterate: Regularly review and update dashboards based on feedback from users to ensure they remain relevant and useful. Continuous improvement is key to effective monitoring.
Example Dashboard Components
When designing your dashboard, consider including the following components:
- Real-Time Query Performance: A chart displaying the most recent query execution times, highlighting any outliers that may need attention. This can help identify queries that require optimization.
- User Activity Logs: A table that shows recent logins, including timestamps and IP addresses, to help monitor user behavior. Tracking user activity can help identify unauthorized access effectively.
- Resource Utilization Metrics: Visualizations that show the usage of Snowflake warehouses, including CPU and memory consumption. These metrics can help in scheduling and optimizing compute resources effectively.
By implementing these components, you can create a holistic view of your Snowflake environment that supports informed decision-making.
Query-Level Cost Attribution and Billing Breakdown
Understanding the costs associated with data queries is crucial for managing budgets and optimizing resource allocation. Snowflake offers features that facilitate query-level cost attribution and provide detailed billing breakdowns.
Analyzing Query Costs
By leveraging the QUERY_HISTORY function, you can obtain detailed information about each query’s execution cost. This includes several important metrics:
- Execution Time: How long each query took to complete, which helps in identifying long-running queries that may need optimization. This metric is vital for performance tuning.
- Bytes Scanned: The amount of data processed during execution provides insights into the efficiency of data access patterns. Monitoring bytes scanned can help in optimizing query performance and reducing costs.
- Compute Resource Usage: Insights into the compute resources consumed by each query allow for better resource management. Analyzing resource usage helps in forecasting and budgeting.
By analyzing this data, organizations can gain insights into which queries are the most resource-intensive and adjust their strategies accordingly. This analysis not only aids in cost management but also enhances overall system performance.
Creating Billing Reports
To effectively manage costs, organizations can create billing reports that summarize query-level data. These reports help identify:
- High-Cost Queries: Queries that consume a significant amount of resources, allowing teams to focus on optimization efforts. Identifying high-cost queries is essential for cost reduction.
- Usage Patterns: Trends in resource usage over time, aiding in future resource planning and budget allocation. Understanding usage patterns helps in strategic planning.
Implementing tagging on queries can also help with cost attribution, enabling you to associate costs with specific projects or departments. This practice promotes accountability and transparency in resource utilization.
Best Practices for Cost Management
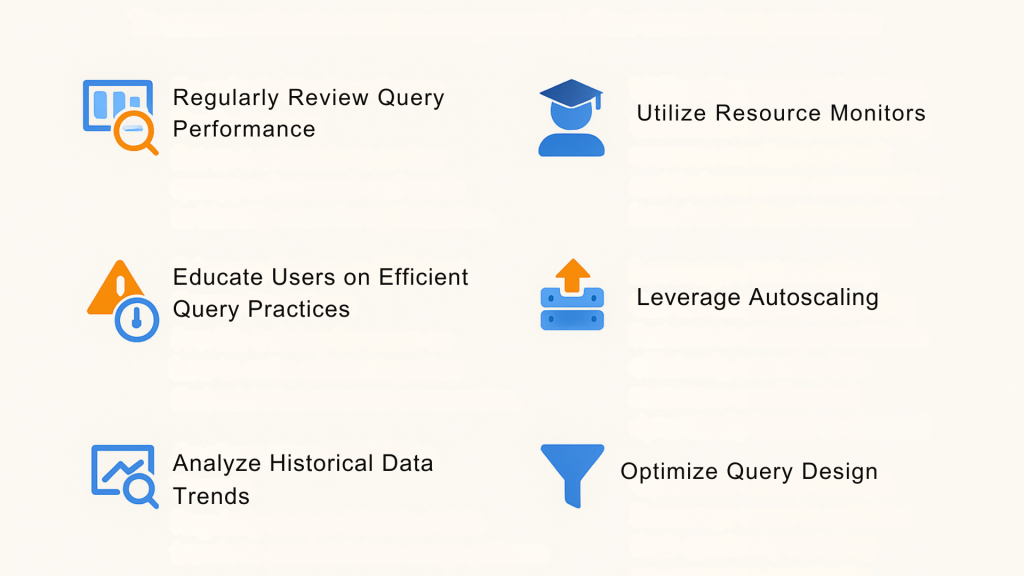
To ensure effective cost management, follow these best practices:
- Regularly Review Query Performance: Set up a schedule to review query performance and costs to identify areas for optimization. This proactive approach can significantly reduce unnecessary expenses.
- Educate Users on Efficient Query Practices: Provide training for users on how to write efficient queries that minimize resource consumption. Encouraging best practices among users helps in maintaining optimal performance.
- Utilize Resource Monitors: Snowflake allows you to set up resource monitors to track and limit resource consumption based on defined thresholds. This helps prevent unexpected spikes in costs, allowing for better budget control.
- Leverage Autoscaling: Use Snowflake’s autoscaling features to manage workloads efficiently, ensuring that resources are allocated dynamically based on demand. This flexibility can lead to significant cost savings.
- Analyze Historical Data Trends: Regularly analyze historical data trends to predict future usage patterns. Understanding these patterns can help in making informed decisions regarding resource allocation.
- Optimize Query Design: Encourage users to optimize their queries by reducing unnecessary complexity. This can include using appropriate filters and avoiding SELECT * statements.
Log Analysis, Anomaly Detection, and Snowflake Monitoring Using Snowflake + External Tools
Log analysis is a critical component of monitoring and observability. By integrating Snowflake with external tools like Splunk or Grafana, organizations can enhance their log analysis capabilities significantly.
Integrating with External Tools
Connecting Snowflake to external monitoring tools allows for deeper insights into log data. For instance:
- Splunk: Use Splunk to aggregate logs from various sources, including Snowflake. With its powerful search and visualization capabilities, teams can analyze logs for anomalies and trends. This integration enables you to correlate Snowflake logs with other application logs, providing a comprehensive view of system behavior.
- Grafana: Grafana can be used to create real-time dashboards that visualize Snowflake metrics alongside other data sources. This helps teams monitor system performance in a unified view, facilitating quicker response times to issues.
Anomaly Detection
Implementing anomaly detection algorithms on log data helps identify unusual patterns that may indicate security breaches or performance issues. By setting up alerts based on these anomalies, organizations can respond quickly to potential threats.
- Machine Learning Models: Consider using machine learning models to analyze logs for patterns and anomalies. These models can learn from historical data and improve over time, providing more accurate predictions and insights.
- Threshold-Based Alerts: Set up alerts for specific metrics that exceed predetermined thresholds, such as unusually high query times or increased login attempts from a single IP address. This proactive approach ensures that potential issues are addressed before they escalate.
Best Practices for Log Analysis
To enhance log analysis, consider the following best practices:
- Centralize Log Management: Ensure that all logs are centralized for easier analysis and monitoring. This makes it simpler to track user activity and system performance.
- Regularly Review Log Data: Establish a process for regularly reviewing logs to identify trends and anomalies. Consistent monitoring can help catch issues early.
- Create Actionable Alerts: Design alerts that provide clear actions for response teams, such as escalating events to specific personnel. This clarity can improve response times significantly.
- Use Dashboards for Visualization: Create dashboards that visualize log data, making it easier to spot trends and anomalies at a glance. Visualization tools can help in quickly identifying the root cause of issues.
- Implement Retention Policies: Establish retention policies for logs to manage storage effectively. This ensures that you maintain necessary logs while optimizing storage costs.
Setting Up Alerts and Notifications via Event Tables
Setting up alerts is crucial for maintaining the health of your Snowflake environment. By utilizing Event Tables, you can automate notifications based on specific criteria.
Creating Event Tables
Event Tables in Snowflake allow you to capture and respond to significant events within your account. This can include:
- User Activity: Notifications for unusual login patterns or unauthorized access attempts, which can help enhance security by allowing for immediate investigation.
- Resource Utilization: Alerts for excessive resource consumption that could impact performance, enabling proactive resource management.
Automating Notifications
Integrating Event Tables with notification systems (like email or messaging services) ensures that stakeholders are promptly informed of critical events. This proactive approach helps maintain security and performance standards.
- Define Key Events: Determine which events are critical to your organization’s operations and should trigger alerts. Focus on those that could impact performance or security.
- Set Up Notification Channels: Choose appropriate channels for notifications, such as email, Slack, or SMS, to ensure timely communication. This flexibility allows stakeholders to receive alerts in the most convenient format.
- Test Alert Mechanisms: Regularly test your alert systems to ensure they function as intended and that notifications reach the correct personnel. This practice helps maintain accountability.
- Review and Adjust Alert Parameters: Continuously review alert parameters to minimize false positives while ensuring that critical issues are reported. Fine-tuning these settings can improve the effectiveness of your alerts.
- Provide Training on Response Protocols: Ensure that team members are trained on how to respond to alerts effectively. Clear protocols can reduce response times and improve overall incident management.
Case Study: Optimizing Resource Management at XYZ Corp using Snowflake Monitoring
Background
XYZ Corp, a mid-sized analytics company, was struggling with high operational costs due to inefficient query performance and resource utilization in their Snowflake environment. They decided to implement a comprehensive monitoring and observability strategy to optimize their data operations.
Implementation
- Custom Dashboards: XYZ Corp built custom dashboards using
ACCOUNT_USAGEandINFORMATION_SCHEMAto monitor query performance and user activities. This helped them identify long-running queries and users with excessive resource consumption. - Cost Attribution Reports: They implemented query-level cost attribution, allowing them to track which departments incurred the most costs. This visibility enabled them to allocate budgets more effectively.
- Log Analysis: By integrating Snowflake with Splunk, XYZ Corp enhanced its log analysis capabilities, allowing for real-time monitoring and anomaly detection.
- Automated Alerts: Event Tables were set up to trigger alerts for unusual user activities and resource usage spikes, ensuring the team could respond quickly to potential issues.
Results
After six months of implementing these strategies, XYZ Corp reported a 30% reduction in operational costs, improved query performance by 25%, and enhanced security posture through proactive monitoring. The combination of custom dashboards, cost attribution, and automated alerts proved to be instrumental in optimizing their Snowflake environment.
Conclusion
Monitoring, auditing, and observability in Snowflake are vital for effective data management. By building custom dashboards, analyzing query costs, integrating external tools for log analysis, and setting up alerts, organizations can significantly enhance their Snowflake environments. These practices not only improve performance but also ensure compliance and security, paving the way for successful data governance.
With the right strategies in place, organizations can leverage Snowflake’s capabilities to optimize their data operations and achieve their business objectives. As the data landscape continues to evolve, staying ahead of trends in monitoring and observability will be crucial for maintaining a competitive edge.
FAQs
What is Snowflake’s ACCOUNT_USAGE?
ACCOUNT_USAGE is a schema in Snowflake that contains historical data about account activity, including query history, login history, and warehouse usage. It is essential for monitoring and auditing purposes.
How can I build custom dashboards in Snowflake?
You can build custom dashboards by leveraging ACCOUNT_USAGE and INFORMATION_SCHEMA views. Use data visualization tools like Tableau or Power BI to create dashboards that reflect key performance indicators.
What is query-level cost attribution in Snowflake?
Query-level cost attribution involves analyzing the costs associated with individual queries. This helps organizations identify high-cost queries and optimize them for better resource management.
How can I set up alerts in Snowflake?
Alerts can be set up using Event Tables in Snowflake. By defining key events and integrating with notification systems, you can automate alerts for unusual activities or resource usage.
Why is log analysis important in Snowflake?
Log analysis is crucial for monitoring user activities, identifying anomalies, and ensuring compliance with security policies. Integrating Snowflake with external tools enhances log analysis capabilities.

